Christian P. Sarason | Agile. Ocean. Science. Software.
Using a InfluxDB to manage crowdsourced whale observations
by Christian P. Sarason
On ocean data, timeseries and the wrangling of observations

(warning: this post is kinda wonky and probably filled with far too many generalizations. YMMV)
Ocean science is challenging for many different reasons. Some of these are fundamental: the ocean is always changing and responding to different inputs (weather, climate, river inputs, geology, plate tectonics, biology, chemistry) and to fully understand the system you need to take a lot of different things into account. Some things we can model very accurately (tidal heights) and others are a bit more tricky, often pushing modeling systems to the brink.
In the end we need always ground our modeling efforts in actual observations, and as a result we often rely on using time and space as the fundamental ways to structure our observations. Raw observations almost always have a spatial component (lat, lon, depth) as well as a time (UTC). Processed observations are usually “binned”, allowing us to look at averages (say, for over a square kilometer patch, or by time into monthly averages). Anyone who has processed log files for a website running in production, or who has analyzed data for a business knows this process well — questions like “what is Q4 revenue” or “how many hits/day is our site receiving”. Much of the work of a data analyst or data scientist is figuring out how to process the raw information into something more manageable to think about.
Why use a timeseries DB?
I have been working with @scottveirs on his OrcaSound project to figure out how to leverage some of the map and crowdsourcing concepts I explored with the Sea It Rise project, specifically around the idea of allowing his listeners to start hitting a “I hear something interesting” button and then creating some kind of map-based visualization/notification system.
In this case the thing we want to know (the location ofOrca or other vocalizing whales) is possible because of hydrophones located as specific know locations. The basic idea is to create a DB of audio snippets at different hydrophones that correspond to “interesting” periods and then see what kinds of time/space patterns we might observe. At it’s core, this is a time series use case, and I was inspired by a talk from @vsivsi at the Cabled Array Hack Week where he talked about using some DevOps tools, including InfluxDB, as a way to archive observations from an oceanographic cruise. I decided that I needed to learn more, as I didn’t have much experience with a timeseries DB, but it strikes me as a powerful tool for processing oceanographic observation and modeling data.
What now?
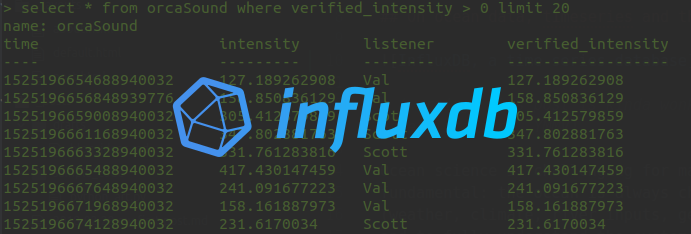
In order to have some data to play around with, I created the Orca Simulator and made a bunch of fake data to play with. The data is stuctured in a very basic manner, especially since I’m just learning how this stuff works.
The basic structure is to have every measurement have a basic “intensity” rating (this would be automatically derived, and be a measure of the strength of the signal) and a tag for which listener discovered the signal. These raw measurements will then make their way into a “verification” queue, and, once verified have updated fields that include the verified intensity, who verified it, a rating, etc.
The basic flow for a given observation would be something like:
- raw signal –> detected with “intensity” –> verified –> rated
On the output side, I am looking to be able to answer questions like:
select * from limeKiln where listener="Scott" and intensity > 100 and rating > 3.5
This is InfluxQL (pretty much like SQL, but with some differences to deal with the timeseries nature of InfluxDB).
I’m sure this could all be done just peachy in Postgres or MySQL, but this project is a good way to learn about other options. The data retention policies and focus of InfluxDB on ingesting large volumes of time-based data makes it a nice fit for our purposes, as we could choose to only retain verified observations and let any other detections just roll into the deep archive.
Can it do it? I think so. What follows are some “scratchpad” notes for different things i need to remember how I did later when I get the full system up and running.
Some raw notes from playing around with InfluxDB
use “into” to create a new field for a given measurement point
select intensity as "verified_intensity" into limeKiln from limeKiln where listener='AutoDetect' and intensity > 100 group by *
insert new observation
This uses the InfluxDB format. Note that the “timestamp” plus the measurement, field, and tag key make a unique “point”. InfluxDB indexes on tags, and otherwise returns all values in the measurement series that match your selection criteria.
- Measurement: audiostream
- field: intensity (100.9)
- timestamp: 15263
- tag: listener (Fritz)
insert audiostream,listener=Fritz intensity=100.9 15263
Add a rating for this specific measurement
insert audiostream,listener=Fritz intensity=100.9,rating=3,num_ratings=1 15263
insert new rating (updating average), and increment num of ratings
This one retrieves a point that has a rating, creates a new average and increments the num_ratings by 1.
select ( rating*num_ratings + 4 ) / (num_ratings + 1) as rating , num_ratings + 1 as num_ratings into audiostream from audiostream where listener='Fritz' and time= group by *
Next
TODO: now, need to abstract this to some curl and/or javascript calls for dynamic updating from a web page. Still….progress!
tags: tech4good - timeseries - InfluxDB