Christian P. Sarason | Agile. Ocean. Science. Software.
Playing with Planet, Inc.
by Christian P. Sarason
Satellite imagery for fun an profit
I have been following Planet, Inc. for quite awhile, born out of a renewed interest in industrial applications that started back in 2010-11 when I was working at 3TIER. Our customers were looking for satellite imagery to complement our renewable energy assessment products, so I dove in a bit on the topic. Satellite imagery is one of those things that gives you a real sense of wonder that it all just works — something that I have appreciated from my teaching days, where I used the SeaWifs data to talk about global plant productivity, the seasons and the differences between the northern and southern hemispheres.
The industrial application is quite a bit more focused; for my renewable energy customers it centers around site suitability (road access? non-obvious hazards?) and engineering, rather than primary productivity indices, but fun of working with that data remains. Last year I saw a talk by Planet’s Kelsey Jordahl, where I learned of their mission to map the entire planet once per day and start building a timeseries of landscape change. It blew me away — and a couple weeks ago I came across their jupyter notebooks, designed as easy entry to “play with our data”. Sounds like a great plan to me!
Getting started
This usually is the hardest part. Since the bulk of my training and noodling around with computers is in the scientific software realm, I have spent far too many hours compiling other people’s code, discovering undocumented dependencies and struggling through various listservs trying to get stuff to work. All par for the DataScience course, at least circa 2000-2008, when I was coding to pay the bills. These days? Easy peasy.
First, Planet has a great github repository with everything you need, including docs at:
https://github.com/planetlabs/notebooks
Note the awesomesauce that is Docker to solve the dependency problem — I am so used to the README saying things like, “installation: make all” … and then unraveling all the failures! Not so here, just clone the repo, fire up their docker command and wait a bit as it downloads everything you need. So sweet. As I was typing this, I got distracted and started browsing the notebooks on GitHub. But running it interactively is the whole point!
«fires up jupyter notebook according to the instructions provided»
10 minutes later
“Wow, this notebook is cool, and I can adjust the code to test out the concepts!”
2 hours of fun later.
Whew. I made it through the first api introduction and ran into very little trouble. The fun part was playing around with some of the examples and getting different results from what is in the notebook — these are really powerful documentation examples because it is so easy to get lost in the question, “OK, now where do I start?!?” with most products. Planet makes it easy to just get rolling with common operations and then extend.
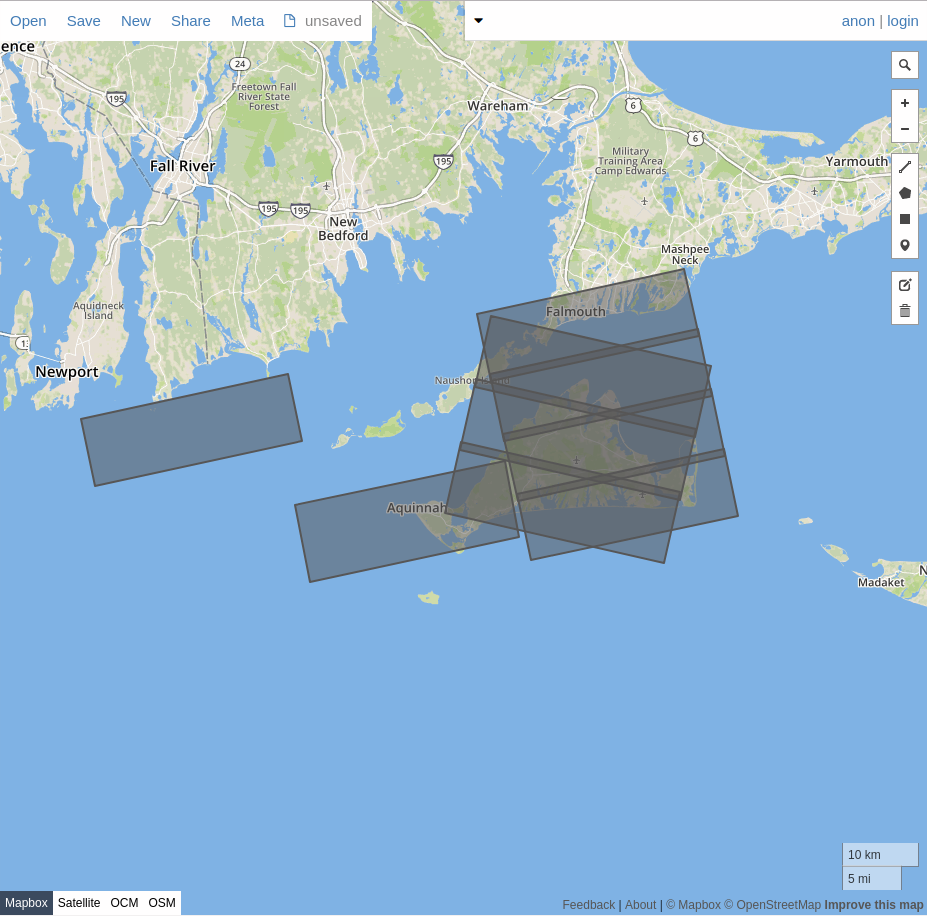
To make this work I just worked through the notebook example, changed the geojson to be different (zoomed in on my fair island of origin) and plowed forward. This is really going to be a hoot!
Application from the “Fun” side of the house: Surf Detection
Now, this is interesting as far as it goes, but where to go? As any Oceanography instructor will tell you, there are generally 3 major student archetypes that sign up for Ocean 101. This is the subject for another post all together, but suffice it to say, 1 major demographic is “Water Nut in Search of Nirvana”. Loosely translated, this might apply to a surfer looking for waves, a sailor looking for wind, a kiteboarder looking for both or other stoked individuals. Now that I’ve played just a wee bit, I think I have a suitable problem area for blogging about with examples —> “WaterSportsCam”.
As a test case, I’m thinking I will use the surf conditions at Squibnocket and Aquinnah on Martha’s Vineyard as my target area of interest. Not only are they my home break, I still have friends that surf there regularly (throughout the year) and if my WaterSportsCam would ever be useful, why not start there?
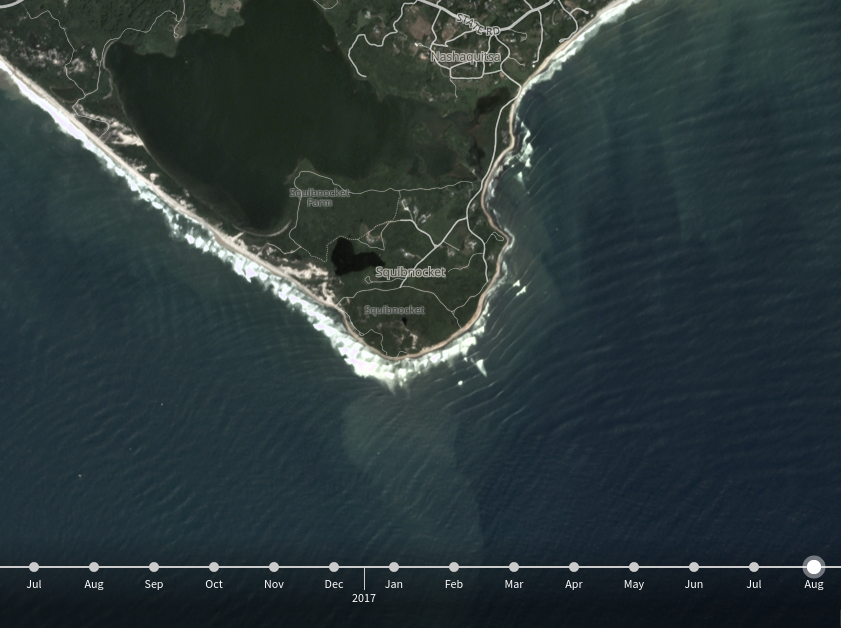
If you look at the August 2017 summary image for Squibnocket, you’ll notice that there is a nicely developed surf rolling in from the south and bending around Squibnocket point.
More on how I plan to use Planet’s data to help build a “It was an Epic Day” tool in some future post!
tags: living-in-the-future - jupyter - remote-sensing - tech4good